
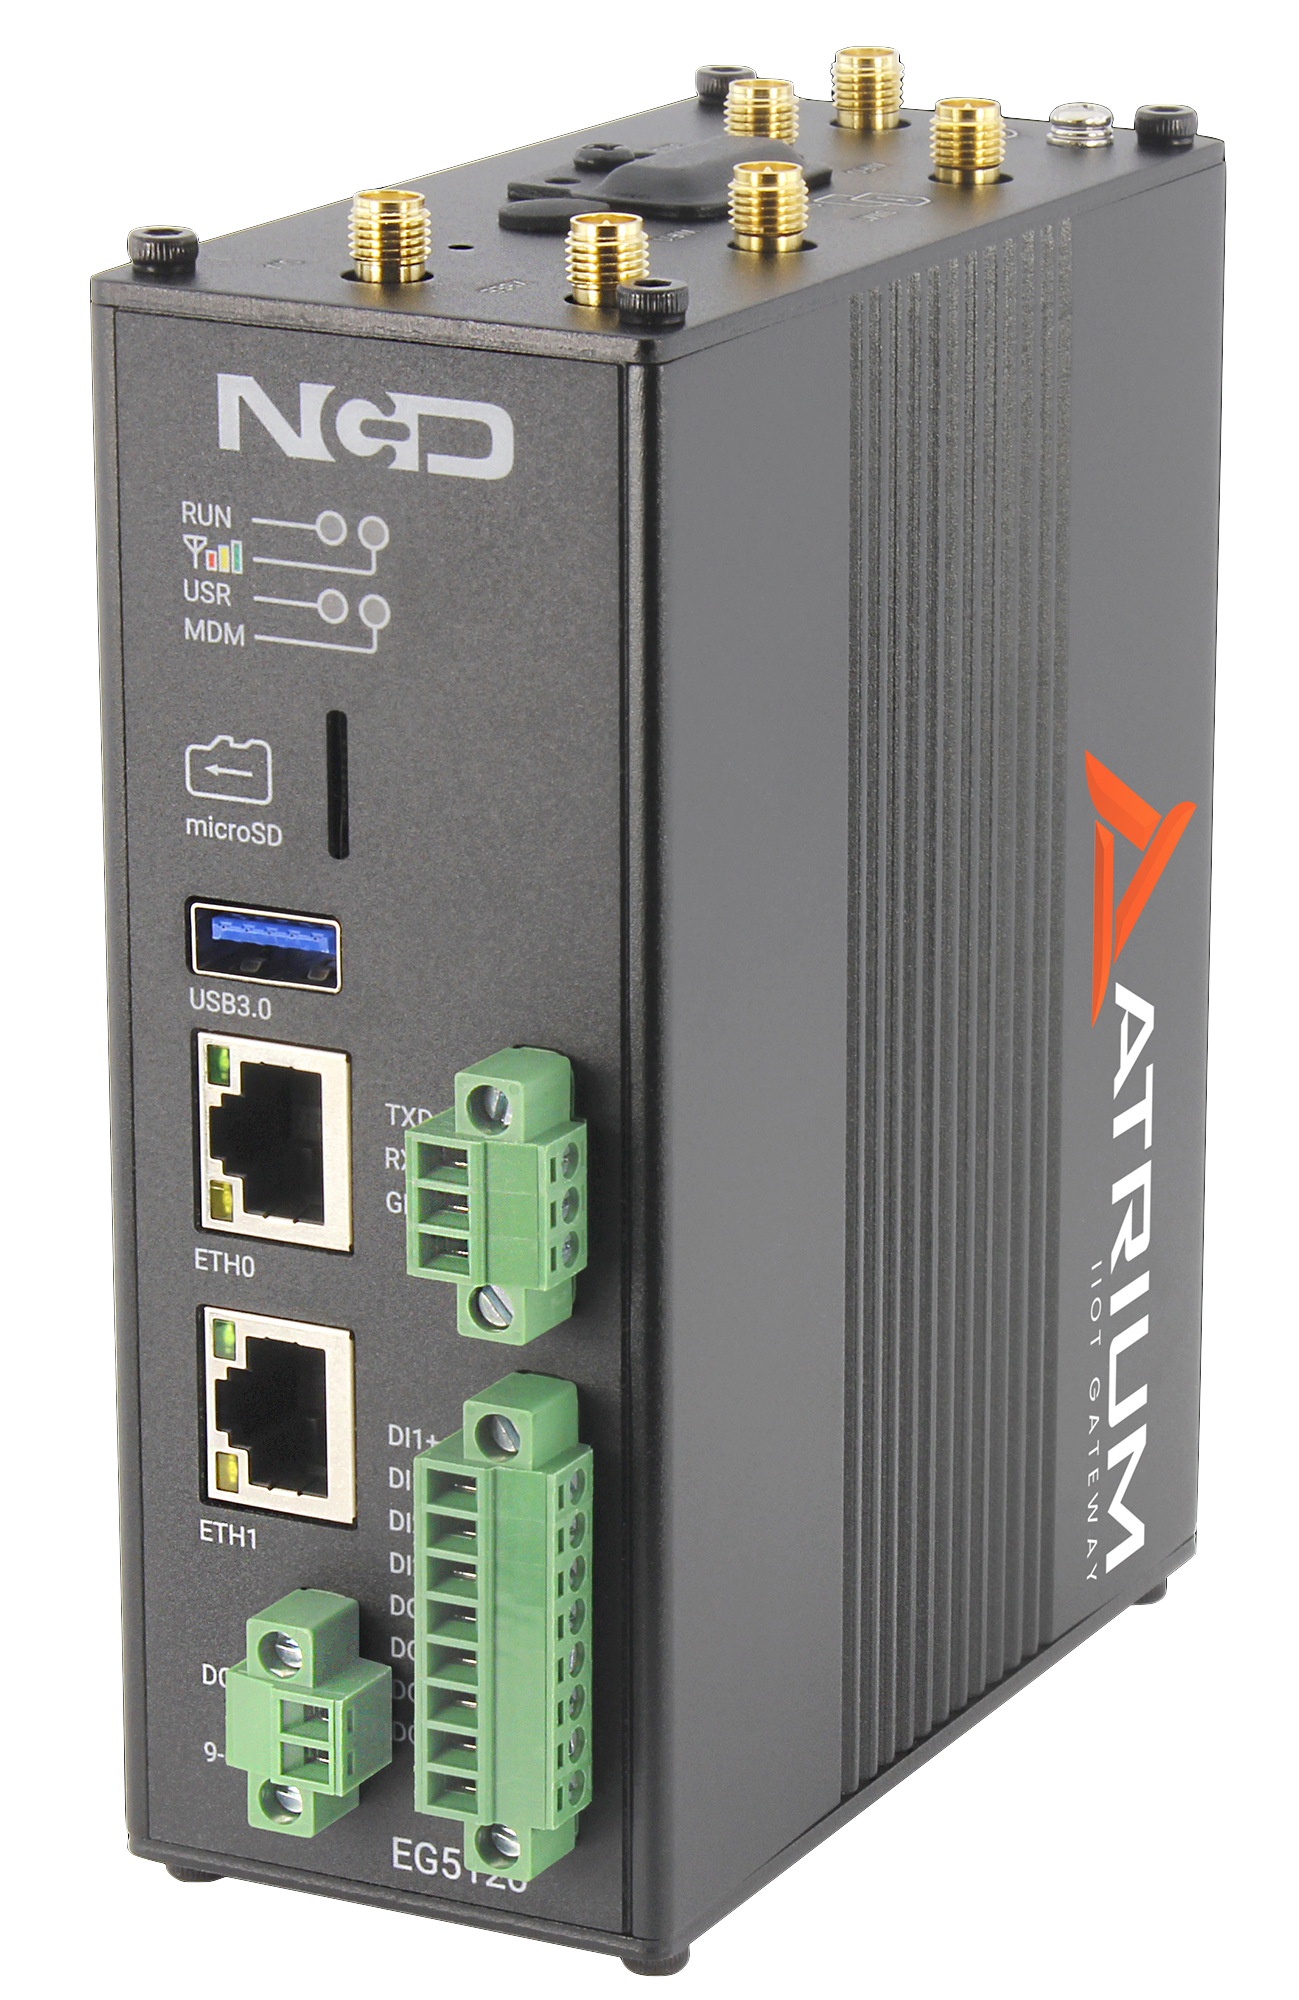
No server to provision, no cloud tenant to configure, no code to write. Power it on, join your sensors, and start building views in the browser.
Plug in the gateway. Wi-Fi comes up in access-point mode by default, so you connect straight from a laptop or phone, no network setup required to reach the interface the first time.
The built-in wireless mesh receiver hears every NCD wireless sensor in range. Whitelist the nodes you want, name them by asset or location, and readings start landing in the on-board database immediately.
Drag gauges, line graphs, and status cards onto a monitoring view for any audience, operators, maintenance, or leadership. Every widget auto-refreshes, with a fullscreen mode for wall displays.
Set threshold triggers, wire them to email actions, and schedule reports. When you want eyes on it from anywhere, the flagship gateway opens a secure remote link, without handing your data to a cloud platform.
The Atrium Gateway isn’t just a data receiver. It’s a complete industrial IoT platform with dashboards, alerts, reporting, OEE tracking, and productivity monitoring built in and running on the box. Open your browser and go.
One gateway hears every sensor over long-range wireless mesh, processes and stores the data locally, then pushes it to any dashboard, MQTT broker, or cloud you choose, no server to stand up and no per-sensor fee.
Drag-and-drop widgets let you build custom monitoring views for any audience, operators on the floor, maintenance managers, or front-office leadership. Mix pressure, temperature, vibration, current, and any other sensor on one screen, and every dashboard auto-refreshes with a fullscreen mode for wall-mounted displays.
In Atrium, Triggers are threshold conditions on a single sensor metric, they fire when a value crosses the line. Actions link one or more triggers to responses like email or relay control, and run when every trigger is met. You build both in the browser, no code required.
| Name | Sensor | Metric | Cond. | Thresh. | Current | Status |
|---|---|---|---|---|---|---|
| High Pressure | Air Compressor | Pressure | Above | 120 PSI | 92 PSI | OK |
| Cold Room Warm | Cold Room | Temperature | Above | 8 °C | 11 °C | TRIGGERED |
| Pump Vibration | Process Pump | RMS Velocity | Above | 7.0 mm/s | 4.2 mm/s | OK |
| Low Battery | Main Feeder | Battery V | Below | 2.80 V | 3.30 V | OK |
| Name | Triggers | Action | Status |
|---|---|---|---|
| Cold Room Escalation | Cold Room Warm (Cold Room) MET | Email (trigger+clear) maintenance@plant.com | ACTIVE |
| Compressor Watch | High Pressure (Air Compressor) | Email (on trigger) ops@plant.com | OK |
| Battery Notice | Low Battery (Main Feeder) | Email (trigger+clear) reliability@plant.com | OK |
The Productivity Monitor app uses sensor data to automatically detect when machines are running, idle, or stopped. Get shift-level utilization without installing a single additional sensor or connecting to your PLC.
An upcoming built-in app will calculate Overall Equipment Effectiveness automatically from sensor-based runtime data. Availability, Performance, and Quality metrics will roll up into a single OEE score for every monitored asset, no manual data entry, no spreadsheets. Here’s what it will do:
Schedule recurring reports delivered straight to stakeholders’ inboxes. Fleet summaries, sensor group roll-ups, and alert digests, all generated on the gateway and emailed on your chosen cadence.
| Name | Type | Format | Schedule | Last Sent | Enabled |
|---|---|---|---|---|---|
| Plant Fleet Summary | Fleet Summary | Daily at 6:00 AM | 07/06/2026 | ON | |
| Alert Digest | Alert Digest | CSV | Daily at 8:00 AM | 07/06/2026 | ON |
| Compressor Room Group | Sensor Group | PDF+CSV | Monday at 8:00 AM | 07/06/2026 | ON |
| Cold Storage Roll-Up | Fleet Summary | Monday at 7:00 AM | 06/29/2026 | ON | |
| Telemetry Export | Custom SQL Query | CSV | Daily at 11:55 PM | 07/06/2026 | ON |
The App Center runs on the gateway itself, an app store on your own hardware with no cloud account and nothing to sign into somewhere else. Browse the catalog in your browser, install what the job needs in seconds, and update it in place. Your gateway starts as a lean core and grows only where your operation actually needs it.
Atrium runs as a fully self-contained system, but when you need to integrate, it’s ready. Forward readings to cloud platforms, databases, or your own software over open protocols, or enable Node-RED for a visual flow editor when you want to build something custom.
Update from Settings, then Updates, and your sensor data and settings are preserved. The update costs nothing and Site Survey is free. Connecting an AI assistant uses your own account with your AI provider, and AssetPulse is a licensed app.
Everything runs locally on the gateway. No cloud dependency. No software license.
A 1.6 GHz quad-core processor and 2 GB of DDR4 run the web interface, dashboards, alerting engine, and database right on the gateway. It is fully self-sufficient, no cloud backend required to see and act on your data.
A built-in long-range wireless mesh receiver pulls in readings from more than 100 NCD wireless sensor types, pressure, temperature, vibration, current, level, and more, over a self-healing mesh reaching up to 2 miles line-of-sight. It listens on sub-GHz (868 / 900 MHz) bands, whose sub-gigahertz signals travel farther and punch through walls and structures far better than higher-frequency Wi-Fi or Bluetooth, so one gateway blankets a whole site.
Build monitoring views by dragging widgets in the browser, then set threshold triggers that fire email notifications or actuate relays. Operators, maintenance, and management each get the view they need without a developer.
Every reading lands in an on-board SQL database, so your history stays on your network, queryable directly, exportable to CSV, and forwardable to any CMMS or cloud you choose. Readings are retained on the gateway whether it is online or offline, so an internet outage never costs you data. Your history is never held hostage.
Two configurable Ethernet ports, dual-band Wi-Fi, and cellular keep the gateway connected however your site allows. The flagship model adds a secure remote link so you can watch the plant from anywhere, without renting a cloud platform.
New features and fixes arrive as one-click over-the-air updates, and new built-in apps land the same way, at no additional cost. The gateway you buy today keeps getting better without a truck roll.
| Processor | 1.6 GHz quad-core |
| Memory | 2 GB DDR4 |
| Web Interface | Browser-based; served locally by the gateway (no cloud backend required) |
| On-Board Database | Built-in SQL time-series store, on the gateway |
| Firmware Updates | Over-the-air (OTA), one-click |
| Radio | Built-in long-range self-healing wireless mesh receiver |
| Frequency Bands | 868 MHz / 900 MHz / 2.4 GHz |
| Band class | Sub-GHz (868 / 900 MHz) — sub-gigahertz radio travels farther and penetrates walls and structures far better than higher-frequency Wi-Fi or Bluetooth |
| Regional Options | 900 MHz (North & South America); 868 MHz (Europe); 2.4 GHz (worldwide, reduced range) |
| Range (line of sight) | Up to ~2 miles (868/900MHz); ~1 mile (2.4GHz) |
| Sensor Support | 100+ NCD wireless sensor types |
| Ethernet | 2 ports, ETH0 acts as a client, ETH1 creates its own network; both configurable with customizable firewalls |
| Wi-Fi | 802.11 a/b/g/n/ac, 2.4 GHz & 5 GHz; WEP, WPA/WPA2, AES-CCMP security |
| Wi-Fi Setup Mode | Defaults to AP mode for easy access during initial configuration |
| Cellular | Built-in cellular option |
| Remote Access | Secure Cloudflare tunnel for remote dashboards (flagship model) |
| Sensor Management | Sensor list, health, dashboards, and per-sensor configuration in the browser |
| Alerts | Threshold triggers with hysteresis, offline-device detection, and email (SMTP) notifications |
| Reporting | Scheduled email reports (fleet summary, sensor group, alert digest) in PDF/CSV |
| Cloud & Data | Forward to AWS, Azure, and other platforms via MQTT and a REST API; direct SQL access |
| Node-RED | Pre-installed and optional, enable from Gateway Config for custom flows |
| Part number | NCD-Atrium-GW |
Because Atrium ingests any NCD wireless sensor, a single gateway can run monitoring for maintenance, environment, energy, and productivity all at once.
 Predictive Maintenance
Trend vibration, temperature, and current across motors, pumps, and compressors, and get an alert when a machine starts drifting toward failure.
 Environmental Monitoring
Watch temperature, humidity, and air quality across cold rooms, cleanrooms, and storage zones, with email alerts the moment a space drifts out of range.
 Energy Monitoring
Pull in current and power readings to see where consumption goes, spot idle draw, and build the case for efficiency projects, without a metering contractor.
 Productivity & OEE
Turn sensor-detected run/stop time into shift utilization and Overall Equipment Effectiveness scores, with no PLC tap and no MES to license.
 Remote Site Monitoring
Long-range mesh and cellular let one gateway cover a pump station, tank farm, or off-grid site and still report in, even where wired networks never reach.
 Whole-Plant Dashboards
Mix every sensor type on one screen and put it on a wall display, so the whole plant’s live status is visible at a glance from the floor or the front office.
The same 10 sensors, monitored for three years. With Atrium it’s one purchase. With a cloud IoT subscription it’s a bill that never stops, and grows with every sensor you add.
The Atrium Gateway puts a whole plant’s worth of wireless sensor data on one screen, across the industries that run on uptime.
Monitor motors, compressors, and lines for vibration, temperature, and runtime, and roll it up into productivity and OEE without a PLC tap.
Instrument pump stations, tanks, and remote sites over long-range mesh, and see level, pressure, and flow from one gateway.
Track temperature, humidity, and equipment health across a building and put live status on a wall display in the maintenance office.
Aggregate current, power, and environmental readings on-site, with alerts and history that live on your network rather than a vendor cloud.
Log cold-storage and process temperatures automatically for compliance, and get an email the moment a room drifts out of range.
Keep a continuous, exportable record of storage conditions on the gateway, so an audit trail is always ready and never stuck in the cloud.
Watch pressure, temperature, and tank level across a site over wireless mesh, with data kept local and no per-sensor cloud fee.
Cover fields, barns, and remote pump sites with long-range wireless and cellular, reporting soil, climate, and tank data back to one gateway.
Monitor environment, doors, and equipment across a warehouse and see it all from a single dashboard, wired or wireless.
Answers to the most common questions about the Atrium IIoT Gateway.
The Atrium IIoT Gateway is a self-contained industrial IoT platform that receives data from NCD wireless sensors and turns it into dashboards, alerts, and reports, all running on the gateway itself. It has a built-in long-range wireless receiver, a 1.6 GHz quad-core processor, 2 GB of memory, and an on-board SQL database, so you get a complete monitoring system in one box with no cloud backend required.
Yes, from Atrium 2.6.0 onward. You can point an AI assistant at the gateway and ask about your equipment in plain language, and it can act as well, from changing a sensor's reporting interval to running an installed app's action. Access is granted as thirteen individual permissions rather than one on/off switch, so an assistant given only read permissions can look at everything and change nothing, and you can revoke it in one click. When you ask it to keep watching something it writes the rule into the gateway, so Atrium keeps evaluating that rule with nothing connected.
No. The Atrium Gateway is a one-time purchase with no monthly software fee. The web interface, dashboards, alerting, reporting, and database all run on the gateway you own, and your data stays on your network. There are no per-sensor cloud charges and no contract to keep your monitoring running.
No cloud account is required. The Atrium Gateway stores readings locally and serves its dashboards over your own network, so monitoring keeps working even when the internet is down. The gateway retains your data whether it is online or offline, readings are captured to the on-board database continuously, so an internet outage never leaves a gap in your history. If you want to view the gateway remotely, the flagship model can open a secure remote link, and you can optionally forward data to AWS, Azure, or another platform, but none of that is required to get full use of the gateway.
The Atrium Gateway works with the full line of NCD long-range wireless sensors, more than 100 sensor types spanning pressure, temperature, vibration, current, level, environmental, and productivity monitoring. It ingests their telemetry generically, so a single gateway can manage a mixed fleet of many different sensor types at once.
NCD sensors reach the gateway at up to roughly 2 miles line-of-sight on the 868/900MHz bands, and about 1 mile on the worldwide 2.4 GHz band, using a self-healing wireless mesh. The 868 and 900 MHz options are sub-GHz (sub-gigahertz) bands, and sub-gigahertz radio travels farther and penetrates walls and structures far better than higher-frequency 2.4 GHz, which is why the sub-GHz options reach roughly twice as far. The gateway offers a 900 MHz option for North and South America, an 868 MHz option for Europe, and a 2.4 GHz option worldwide.
The built-in receiver hears every NCD wireless sensor in range. From the web interface you whitelist the nodes you want to keep, then name them by asset or location. Readings begin landing in the on-board database right away and become available for dashboards, alerts, and reports, no code and no external software.
The Atrium web interface lets you build drag-and-drop dashboards, configure threshold alerts with email notifications, schedule automated PDF and CSV reports, and track machine uptime and productivity from sensor data. It also includes a health view for the gateway itself and a direct SQL query tool. Everything runs in the browser against the gateway, with no development team required.
Yes. The Atrium Gateway can publish readings over MQTT to AWS, Azure, or any other platform, exposes a REST API for custom integrations, and keeps its data in an SQL database you can query directly. Node-RED is also pre-installed and can be enabled for building custom visual flows. You are never locked in, your data can flow anywhere you need it.
Yes. New features and new built-in apps arrive as over-the-air firmware updates at no additional cost. The Productivity Monitor app is available today, with OEE, Energy, Environmental, and Action apps on the roadmap. Because updates are one-click and free, the gateway keeps gaining capability without any new purchase.
The Atrium Gateway has two Ethernet ports, one acts as a client on your network while the other can create its own network, and both are configurable with customizable firewalls. It also includes dual-band 802.11 a/b/g/n/ac Wi-Fi (2.4 GHz and 5 GHz) and a cellular option. Wi-Fi defaults to access-point mode so you can reach the interface easily during first-time setup.
We publish our prices. There is no quote form, no login and no sales call between you and the number. The Ordering section of the spec table names each version we sell and its part number, so you can match the one you want before you order.
No. The Atrium Gateway hears NCD wireless sensors only, so sensors made by other companies do not report to it. It is also the receiver and the software rather than a sensor itself: it collects, stores, displays and acts on readings, but it measures nothing on its own and ships without sensors. Tell us what you need to monitor and we will help you put the sensor list together.
Our engineers answer in public on the community forum, and the thread stays up for the next person with the same question.
Ask on the NCD Community ForumOne purchase. Full ownership. A complete IoT platform that runs on your network, watches your whole fleet of sensors, and never sends you a monthly bill.
Buy Now